


I first saw the per capita loss figure at an industry conference in 2023, projected on a screen in a room full of payment executives. A$1,555 per adult per year — the world’s highest. The room went quiet. Not because the number was surprising to people who work in gambling payments, but because seeing it stripped of context and qualification forces a reckoning with what the data actually says about Australia’s relationship with gambling. Two years later, the number has not improved. If anything, the trajectory continues upward.
Australians lost A$31.5 billion on gambling in the 2022-23 financial year, a record that surpassed the previous high set before the pandemic. This is not a statistic about a niche population of problem gamblers. It is the aggregate of millions of individual decisions — at pokies in pubs, at bookmakers during the races, and increasingly at online casinos funded by PayID deposits. Understanding where these numbers come from and what they mean is part of informed participation in the market.
Per Capita Losses: How Australia Compares Globally
The A$1,555 per adult figure for 2022-23 represented an 11.5% increase over the previous year, and IBISWorld forecasts the number reaching A$1,572.23 in 2025-26. H2 Gambling Capital data cited by the Australian Institute of Family Studies places Australia’s annual gambling losses at $32 billion — the largest per capita gambling losses in the world. No other country comes close.
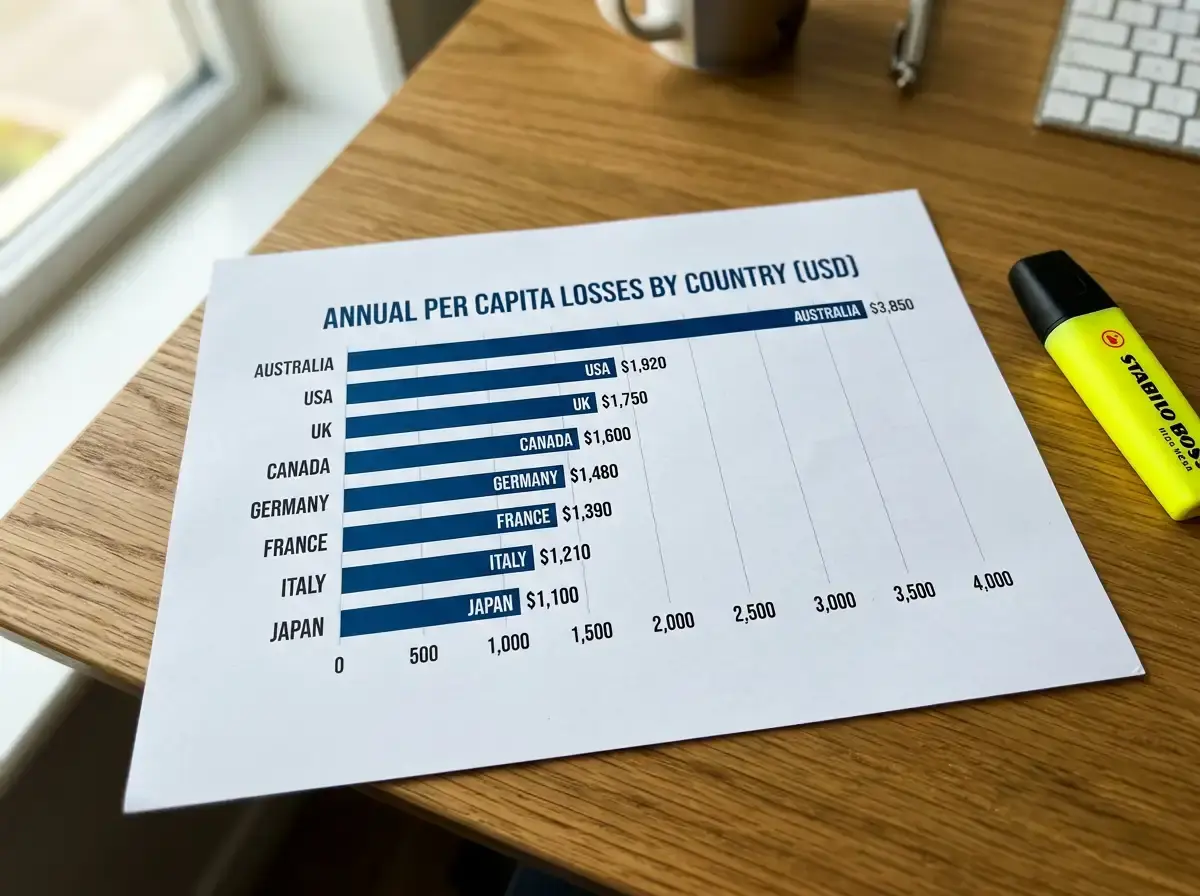
For context, the United Kingdom — often cited as a comparable gambling market — has significantly lower per capita losses despite a much larger absolute market. Canada, another common comparison, is lower still. The gap is driven primarily by Australia’s unique relationship with electronic gaming machines (pokies), which are available in pubs, clubs, and licensed venues across the country and account for the single largest share of total losses. No other jurisdiction permits the same density of high-frequency gaming machines in community venues.
The online component of these losses is growing. While land-based pokies still dominate the total, online platforms are capturing an increasing share of gambling expenditure. The shift is generational: younger Australians are more likely to gamble online than in venues, and the smartphone has replaced the pub as the primary access point for many gamblers. PayID’s integration into this shift is incidental — it is the payment rail, not the cause — but the frictionlessness of mobile PayID deposits is part of the infrastructure that makes online gambling seamlessly accessible.
Online Gambling’s Share of Total Losses
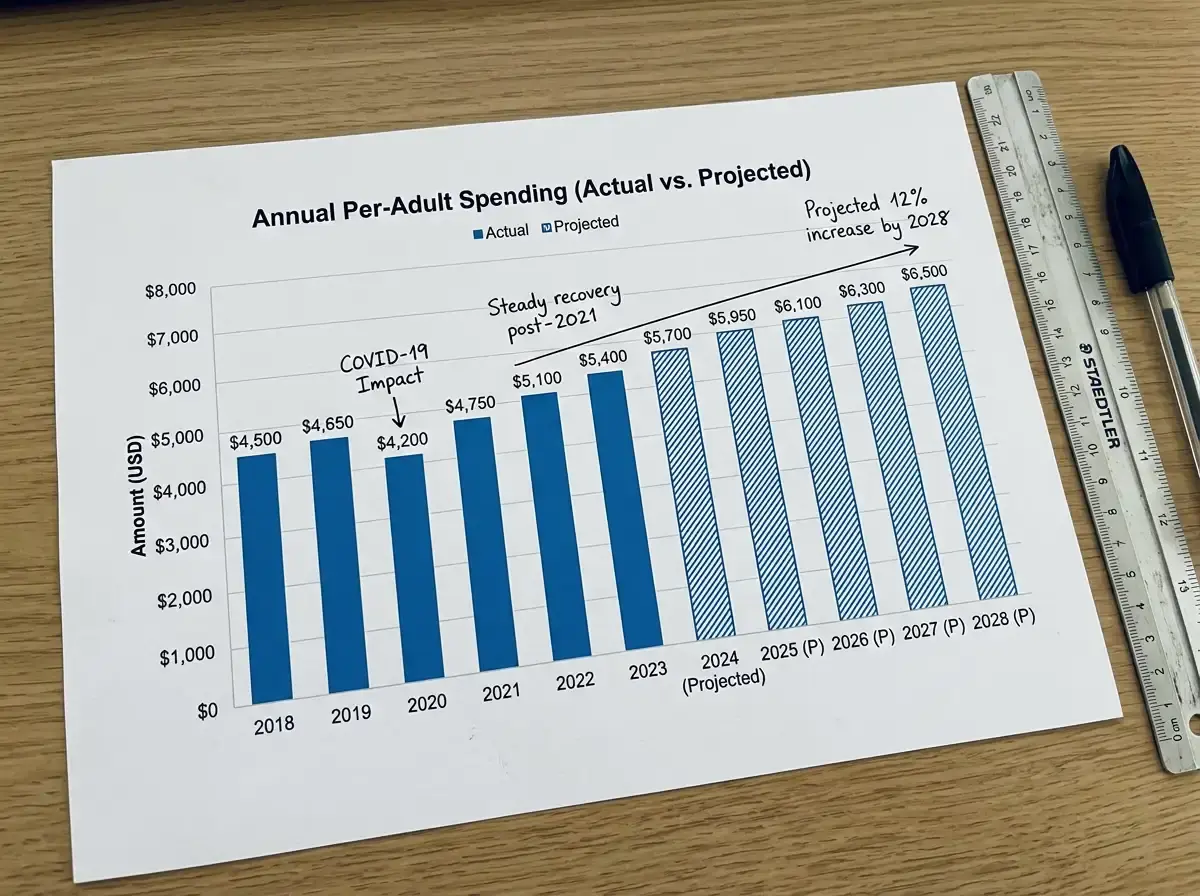
Total wagering turnover hit A$244.3 billion in the 2022-23 year, an 18.2% increase. Online betting alone accounted for A$75.4 billion — a 165.7% year-on-year increase. That is not a typo. Online wagering nearly tripled in a single year, reflecting both genuine growth and improved data capture as more transactions moved through trackable digital payment channels.

The distinction between turnover and losses matters here. Turnover is the total amount wagered; losses are what players lose after winnings are paid out. A player who deposits A$100, wagers A$500 through repeated bets and rebets, and walks away with A$85 has generated A$500 in turnover but only A$15 in losses. The online turnover figures are dramatic, but the loss rate — the percentage of turnover retained by operators — is typically lower for online wagering (5% to 8%) than for pokies (10% to 15%), because online players are more likely to reinvest winnings within the same session.
Still, the absolute growth of online losses is undeniable. The credit card ban in August 2024 removed one friction point (borrowing to gamble) but introduced another convenience (PayID as the default alternative). Whether the net effect on online losses is positive or negative depends on whether the removal of credit access reduces total deposit volume more than the frictionlessness of PayID increases it — a question that the data will answer over the coming years but has not yet settled.
At-Risk Gambling Behaviour on the Rise
The figure that concerns researchers and regulators most is not the aggregate loss number but the at-risk prevalence rate. In 2024, 13.6% of Australian gamblers exhibited at-risk behaviour — up from 11.6% in 2023. That two-percentage-point increase represents hundreds of thousands of additional Australians whose gambling patterns have moved into a range associated with financial harm, relationship strain, and mental health deterioration.

Public attitudes reflect the concern. Polling data shows 77% of Australians believe there are too many gambling opportunities, and 59% believe gambling should be more tightly restricted. These are not fringe positions — they are supermajority views that are driving the regulatory agenda, including the 2027 advertising reform and expanded responsible gambling requirements for licensed operators.
The at-risk figure includes a spectrum of behaviour, from players who occasionally chase losses or exceed their intended spend to those with severe gambling disorders. The prevalence rate does not distinguish between online and offline gamblers, though emerging research suggests that online gambling’s accessibility and speed correlate with faster progression from recreational to at-risk behaviour. The instantaneous nature of PayID deposits — seconds from decision to funded balance — is part of that accessibility equation, which is why bank-level deposit limits and cooling-off periods are important countermeasures.
What This Means for PayID Casino Players Specifically
The aggregate data describes a market. Your individual experience within that market depends on your deposit frequency, your game selection, your session duration, and your relationship with the money you are wagering. The A$1,555 per capita average includes people who spend nothing and people who spend tens of thousands. Averages are useful for understanding systems, not for predicting individual outcomes.

What the data does tell individual players is that the house edge is not abstract. The A$31.5 billion in losses was not bad luck — it was the mathematical consequence of house edges applied across billions of individual wagers. Over time, the house edge ensures that the average player loses. The speed of PayID deposits does not change the maths, but it does compress the timeline. A player who deposits A$100 five times in an evening via PayID has the same house edge exposure as a player who deposits A$500 once, but the multiple-deposit pattern may feel different psychologically — each deposit feels like a fresh start rather than a deeper commitment.
The responsible approach is straightforward: set a budget, use bank-level limits to enforce it, and track your actual spending against the budget. The per capita loss data exists to inform that process, not to moralise about it. Knowing that the average Australian loses A$30 per week to gambling gives you a benchmark. Whether you are above or below that benchmark — and whether you are comfortable with where you sit — is a personal assessment that the data enables but does not prescribe.