


I have spent the better part of two months reconciling market size estimates for Australia’s online gambling sector, and the experience has been an exercise in understanding why three research firms can look at the same industry and produce numbers that differ by billions. The Australian online gambling market is large, growing, and — depending on who you ask — valued at anywhere from USD 1.66 billion to USD 6.13 billion in recent fiscal years. The variation reflects differences in methodology, scope definition, and data sources rather than genuine disagreement about the market’s trajectory. The trajectory is uniformly upward.
Market Valuation: Diverging Estimates Explained
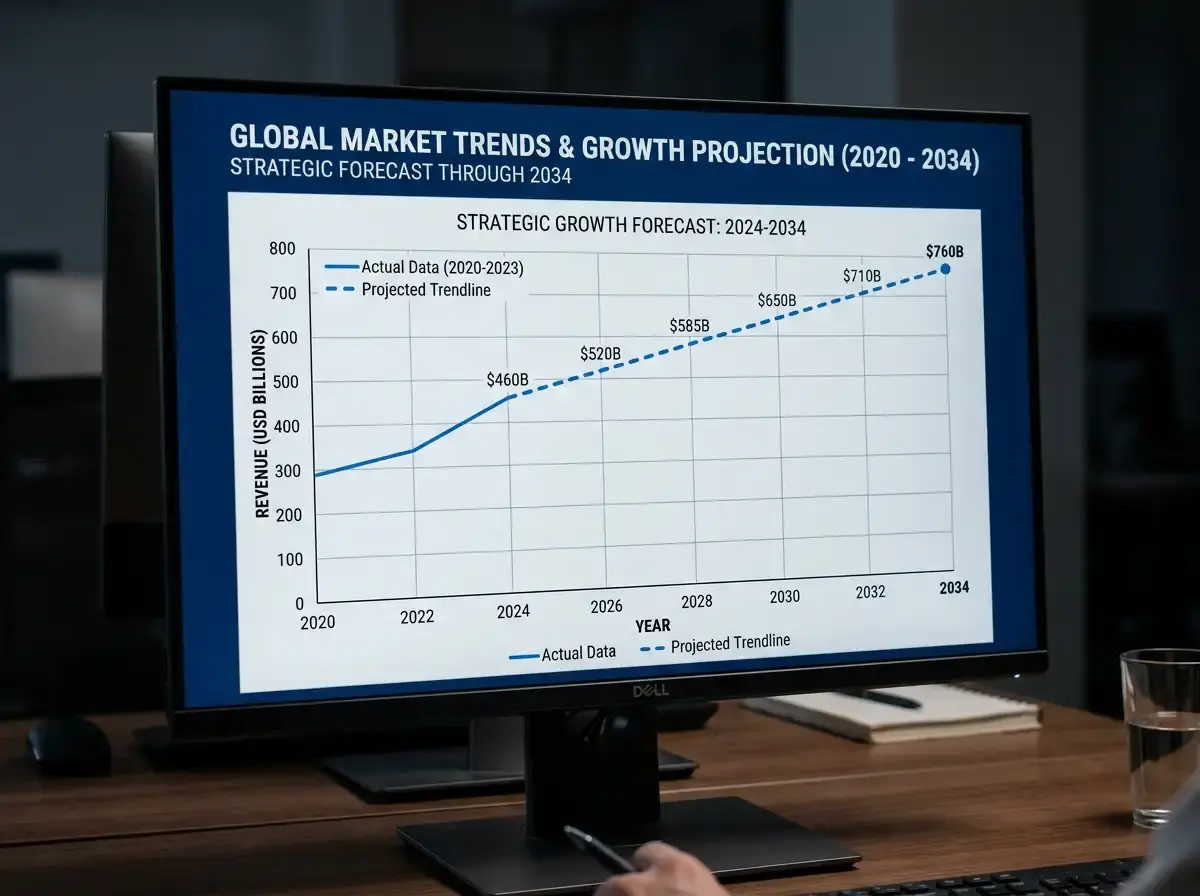
IMARC Group valued the Australian online gambling market at USD 5.5 billion in 2025, with a projection of USD 9.0 billion by 2034 at a compound annual growth rate of 5.67%. Expert Market Research put the figure higher — USD 6,130.48 million (USD 6.13 billion) in 2025, projecting USD 13,101.06 million by 2035 at a CAGR of 7.89%. Grand View Research, using a narrower revenue definition, reported USD 1,657.2 million in 2024, with a projection of USD 3,556.3 million by 2030 at a CAGR of 13.6%.
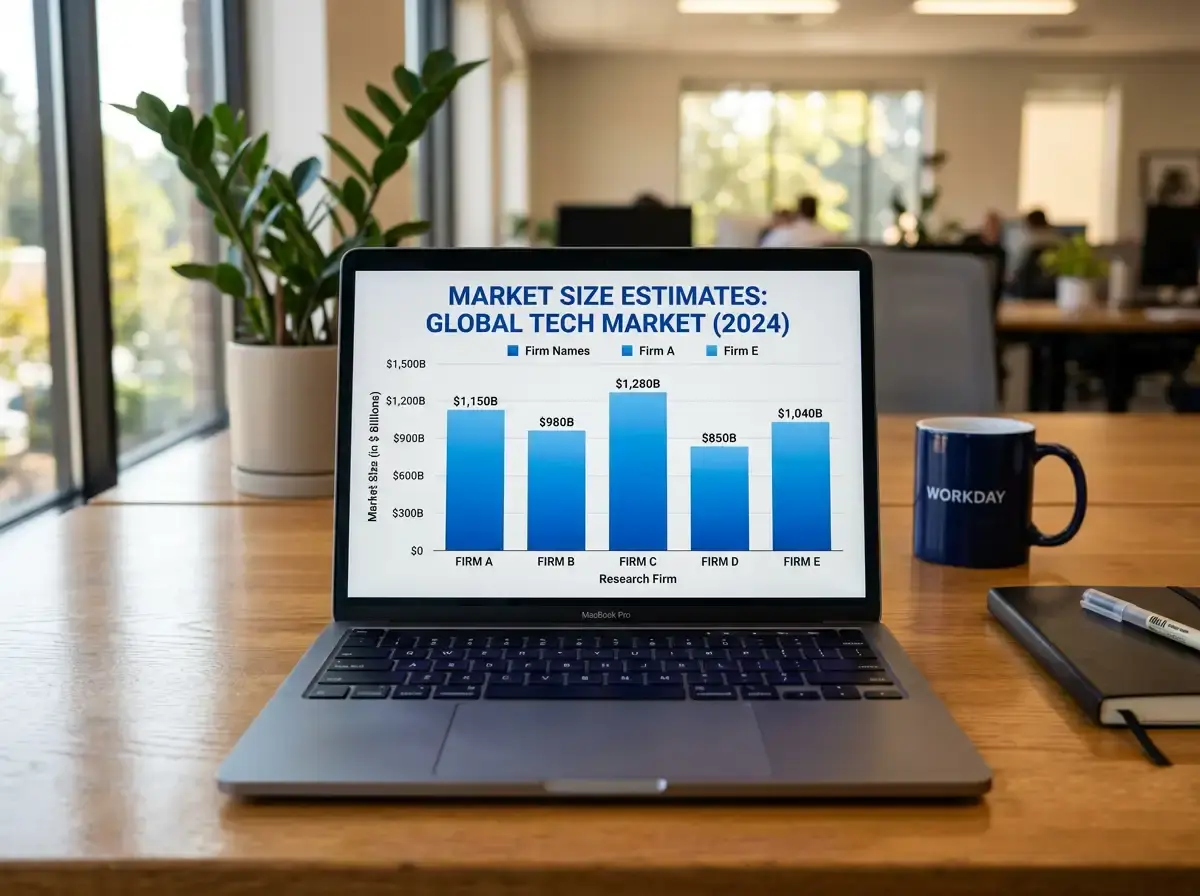
The divergence comes down to what each firm counts as “online gambling.” IMARC and Expert Market Research use broader definitions that include all forms of interactive wagering — sports betting, online casinos, online poker, daily fantasy, and lottery subscriptions. Grand View Research appears to use a narrower scope focused on gross gaming revenue from casino and poker platforms, excluding sports betting turnover. Neither approach is wrong; they answer different questions about the same industry.
For someone trying to understand the actual size of the market their PayID deposits flow into, the most useful figure depends on what activities they participate in. If you bet on sport and play casino games, the broader IMARC estimate captures your market. If you play exclusively at online casinos, Grand View’s narrower figure is more relevant to your segment. The growth rates across all estimates are positive, which is the consistent finding regardless of methodology.
Revenue Breakdown by Vertical
Sports betting dominates the Australian online gambling market by revenue, driven by the cultural significance of sports wagering and the regulatory framework that has licensed domestic operators since 2001. The online betting sector generated AUD 7.1 billion in turnover in 2025, though turnover and revenue are not interchangeable — turnover is total amount wagered, while revenue is the operator’s margin after paying out winnings, typically 8% to 15% of turnover depending on the sport and bet type.
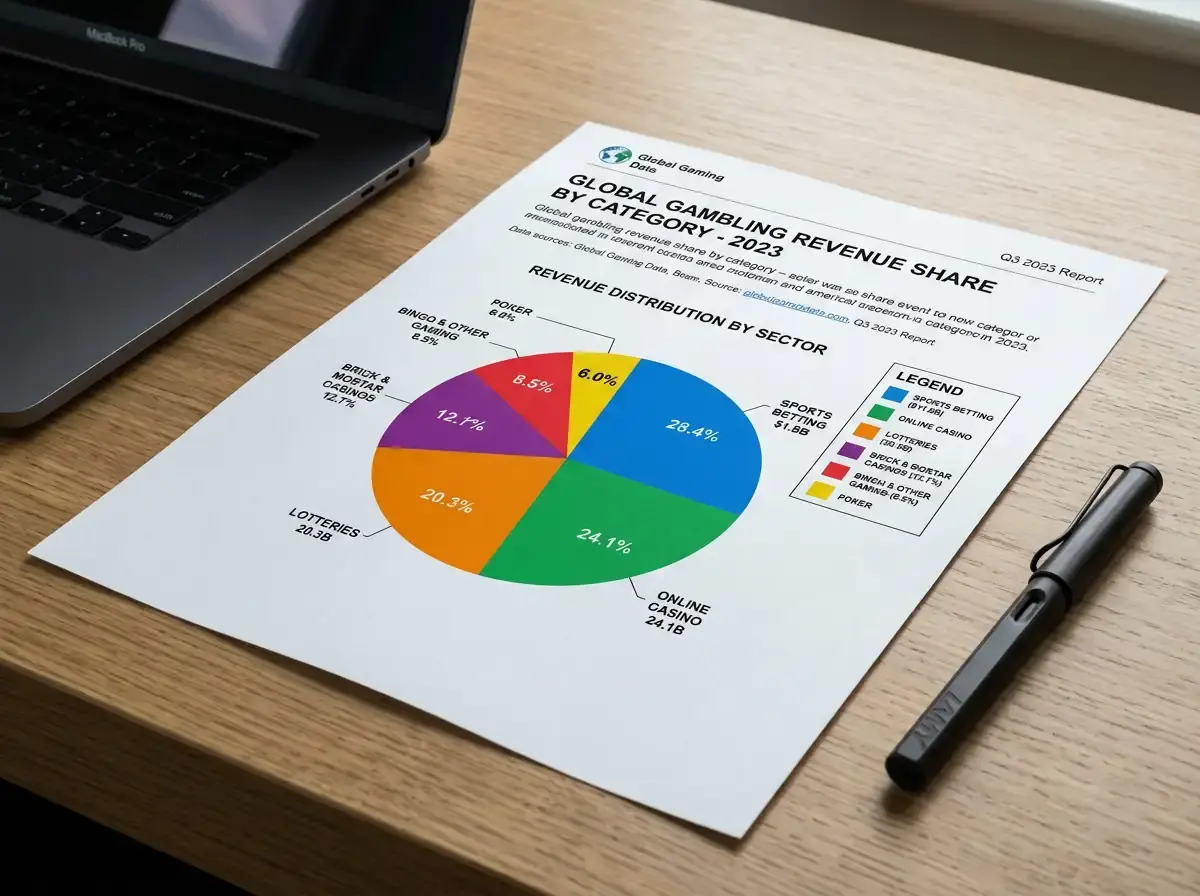
Overall gambling revenue in Australia is approaching US$15.9 billion by 2026, encompassing both online and land-based operations. The online share is growing faster than the land-based share, a trend that accelerated during COVID-19 lockdowns and has not reversed. Total wagering turnover reached A$244.3 billion in the 2022-23 financial year, an 18.2% increase, with online betting specifically hitting A$75.4 billion — a 165.7% increase year-on-year that reflects the structural shift toward digital platforms.
Casino games — pokies, table games, and live dealer — represent the second-largest online vertical. Revenue figures for the offshore casino segment are particularly difficult to pin down because these operators do not report to Australian authorities. Industry estimates suggest Australian players contribute hundreds of millions in gross gaming revenue to offshore casinos annually, with PayID becoming the primary deposit channel following the credit card ban in August 2024.
Player Participation and Behavioural Trends
The participation data tells a nuanced story. In 2024, 60.3% of Australian adults participated in some form of gambling — a figure that sounds high but actually represents a decline from 65.6% in 2019. The overall gambling participation rate is falling even as online gambling revenue grows, which means a smaller percentage of the population is gambling more intensively through digital channels.

Among those who do gamble, 38% of adults bet at least once a week. Online participation specifically sits at 33.4%, predominantly in sports and racing markets. The behavioural trend that concerns regulators most is the rise in at-risk gambling behaviour, which climbed to 13.6% of gamblers in 2024 from 11.6% in 2023. That two-percentage-point increase translates to hundreds of thousands of additional Australians whose gambling habits have moved into a harmful range — a trend that is informing the government’s advertising reform agenda and harm-reduction spending.
The demographic profile of online gamblers skews younger and more male than the general gambling population, with the 25-34 age bracket showing the highest online participation rate. This cohort is also the most likely to use PayID as their primary payment method for non-gambling transactions, which means the pathway from everyday banking to casino deposit requires no behavioural change — just a different recipient in the PayID transfer.
Per Capita Losses: The Global Outlier
Australia consistently ranks as the world’s highest per capita gambling loss country. Australians lost A$31.5 billion on gambling in the 2022-23 financial year — a 20-year record. Per adult, that translates to A$1,555 in losses, an 11.5% increase year-on-year. IBISWorld forecasts this figure rising to A$1,572.23 in 2025-26. By any measure, Australians lose more money to gambling per person than any other nation on earth — $32 billion annually, according to H2 Gambling Capital data cited by the Australian Institute of Family Studies.
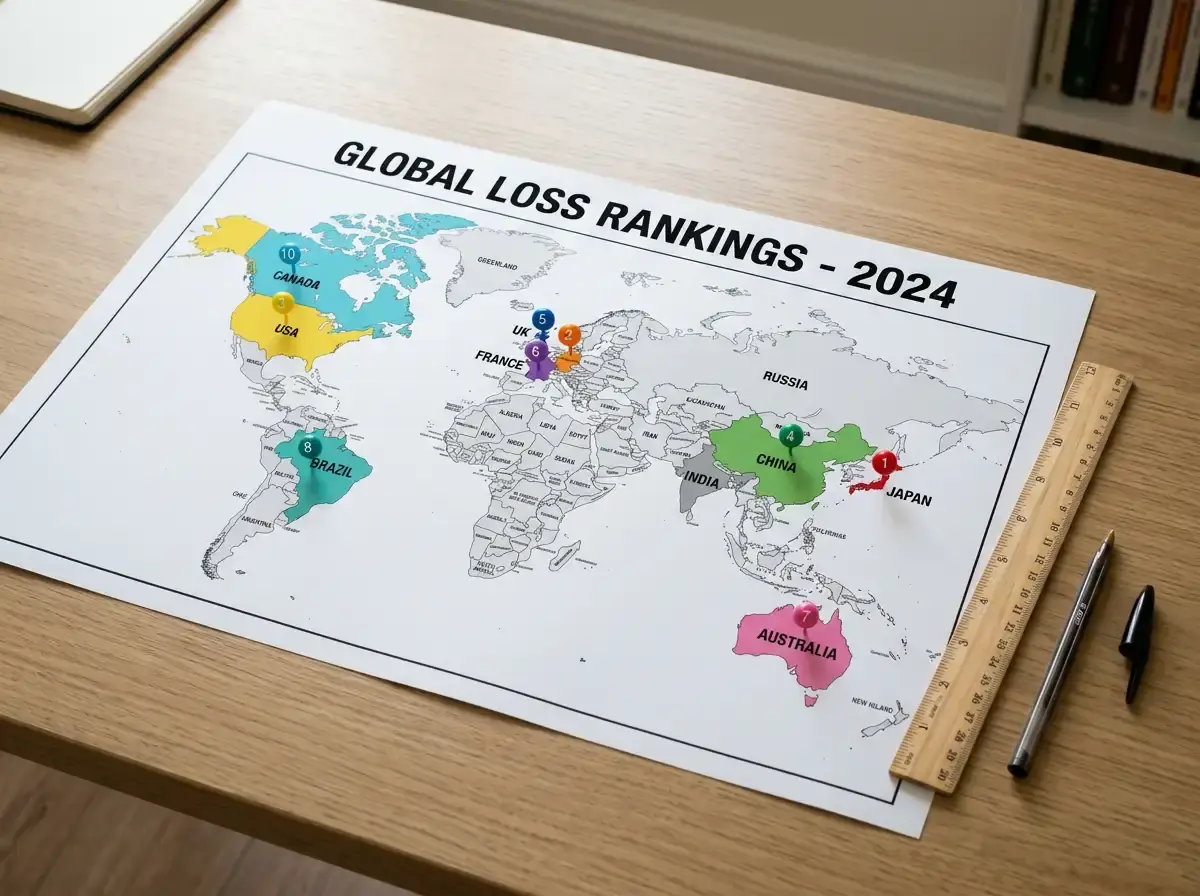
These figures encompass all gambling — pokies in pubs and clubs, horse racing, sports betting, and online casinos. The online component is growing as a share of total losses, though land-based pokies still account for the largest single category. For context, the per capita figure means the average Australian adult loses roughly A$30 per week to gambling. Some lose nothing; others lose vastly more. The average masks enormous variance, and the players at the high end of that distribution are disproportionately affected by the convenience and speed of digital deposit methods including PayID.
None of this data is a reason to avoid online gambling, nor is it a moral judgement. It is context. Understanding the scale of the market you participate in — its revenue flows, its growth trajectory, its regulatory pressures — is part of making informed decisions. Those decisions start with the deposit amount you type into your banking app and extend to how frequently you deposit, which games you play, and whether the session ended because you decided to stop or because the balance hit zero. The data exists to inform that process, not to prescribe it.